

Cozumel stays warm throughout the year, but the weather can feel noticeably different depending on when you visit. Winter generally brings lower temperatures and drier conditions, late spring becomes hotter and more humid, and rainfall increases considerably during parts of summer and fall.
Quick Answer: What is Cozumel Weather Like by Month?
Cozumel is warm year-round, with average daytime highs ranging from about 28°C (82°F) in January and December to 33°C (91°F) in August. March is typically the driest month, while September is the wettest in the climate dataset used for this guide. Caribbean Sea temperatures stay warm at roughly 26–29°C (79–84°F) throughout the year.[1]
For 2026 trip planning, use these monthly averages to compare seasons, then check the current forecast and marine conditions closer to your travel date—especially during the Atlantic hurricane season from June 1 to November 30.[2]
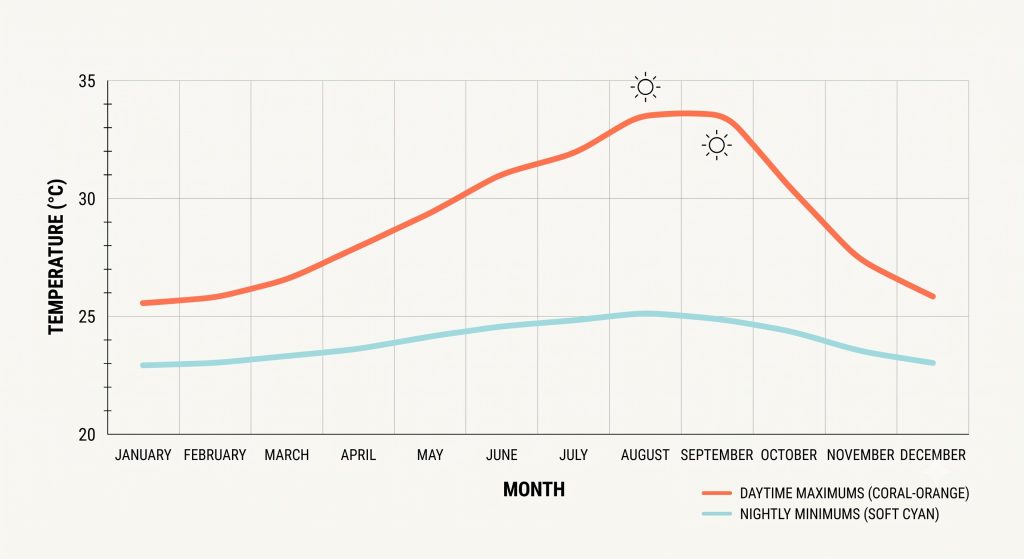
Average daytime highs and nighttime lows across the year in Cozumel.
For travelers planning beach time, snorkeling, diving, or a cruise-port day, the month matters—but monthly climate averages are only part of the picture. Wind, rainfall, sea conditions, tropical systems, and even which side of Cozumel you visit can affect an individual day.
This guide compares Cozumel weather by month, including average daytime highs, nighttime lows, rainfall, rainy days, Caribbean Sea temperatures, humidity, sunshine, and seasonal marine considerations from January through December.
If you are deciding when to travel based on weather plus crowds, prices, and overall trip conditions, see our best time to visit Cozumel guide.
Cozumel Weather by Month: Average Temperatures, Rainfall & Sea Conditions
Cozumel has a hot tropical climate with warm Caribbean water throughout the year. In the long-term climate dataset used below, average daytime highs range from about 28°C (82°F) in January and December to 33°C (91°F) in August. Sea temperatures stay around 26–29°C (79–84°F) throughout the year.[1]
| Month | Avg High | Avg Low | Rainfall | Days With Some Rain | Sea Temp |
| January | 28°C / 82°F | 19°C / 66°F | 77 mm / 3.0 in | 8 | 26°C / 79°F |
| February | 29°C / 84°F | 19°C / 66°F | 57 mm / 2.2 in | 6 | 26°C / 79°F |
| March | 30°C / 86°F | 20°C / 68°F | 38 mm / 1.5 in | 4 | 26°C / 79°F |
| April | 32°C / 90°F | 21°C / 70°F | 46 mm / 1.8 in | 3 | 27°C / 81°F |
| May | 32°C / 90°F | 22°C / 72°F | 110 mm / 4.3 in | 7 | 28°C / 82°F |
| June | 32°C / 90°F | 23°C / 73°F | 188 mm / 7.4 in | 12 | 28°C / 82°F |
| July | 32°C / 90°F | 23°C / 73°F | 121 mm / 4.8 in | 12 | 28°C / 82°F |
| August | 33°C / 91°F | 23°C / 73°F | 146 mm / 5.7 in | 13 | 29°C / 84°F |
| September | 32°C / 90°F | 23°C / 73°F | 237 mm / 9.3 in | 15 | 29°C / 84°F |
| October | 31°C / 88°F | 23°C / 73°F | 212 mm / 8.3 in | 14 | 29°C / 84°F |
| November | 29°C / 84°F | 21°C / 70°F | 105 mm / 4.1 in | 9 | 28°C / 82°F |
| December | 28°C / 82°F | 19°C / 66°F | 96 mm / 3.8 in | 9 | 27°C / 81°F |
At a glance: August has the highest average daytime temperature in this dataset at about 33°C (91°F). March has the lowest average monthly rainfall at about 38 mm (1.5 inches), while September has the highest at about 237 mm (9.3 inches). Water temperatures remain warm year-round and reach about 29°C (84°F) from August through October.[1]
Climate Averages vs. Weather Forecasts: What These Numbers Mean
The figures above are long-term climate averages, not predictions for the exact dates of your vacation.
Weather can vary considerably from year to year and from one day to the next. Monthly averages are useful when deciding which part of the year suits your preferences, but they should not be treated as a forecast for a specific beach or snorkeling day.
Use climate averages for long-range trip planning, then check current forecasts as your travel dates approach. For snorkeling, diving, and other water activities, check wind and marine conditions again on the day of the activity.
The climate dataset used for the table is based on information derived from organizations including the Climatic Research Unit at the University of East Anglia, the UK Met Office, and the Netherlands Meteorological Institute.[1]
Cozumel Weather Month by Month
1. Cozumel Weather in January
January is one of Cozumel’s cooler months, although temperatures remain warm by most standards. Average daytime highs are around 28°C (82°F), while nighttime lows average about 19°C (66°F).
The month receives roughly 77 mm (3.0 inches) of rain across eight days with some rainfall, and the Caribbean Sea averages around 26°C (79°F).[1]
January can be a comfortable choice for travelers who prefer to avoid Cozumel’s more intense summer heat and humidity.
Winter cold fronts can also influence the Yucatán Peninsula, so occasional windy or cooler periods are possible. Research on regional surface winds shows that cold fronts have a stronger influence during approximately October through March.[3]
2. Cozumel Weather in February
February becomes slightly warmer while remaining comparatively dry.
Average daytime highs reach about 29°C (84°F), with nighttime lows near 19°C (66°F). Average monthly rainfall drops to approximately 57 mm (2.2 inches), spread across around six days with some rain. Sea temperature remains close to 26°C (79°F).[1]
For travelers who want warm beach weather without the peak heat and humidity of late spring and summer, February offers one of the milder combinations of temperature and rainfall during the year.
3. Cozumel Weather in March
March is the driest month in the climate dataset used for this guide, averaging approximately 38 mm (1.5 inches) of rainfall and four days with some rain.[1]
Daytime temperatures climb to about 30°C (86°F), while average nighttime lows are around 20°C (68°F). The sea remains close to 26°C (79°F).
March also averages around eight hours of sunshine per day.[1] Sunshine hours and daylight hours are different measurements, however, and neither guarantees clear skies on an individual date.
4. Cozumel Weather in April
April brings a noticeable increase in heat.
Average daytime highs reach approximately 32°C (90°F), compared with nighttime lows around 21°C (70°F).
Rain remains relatively limited in the long-term averages, at approximately 46 mm (1.8 inches) across three days with some rain. Sea temperature rises to around 27°C (81°F).[1]
UV exposure is also strong. The climate dataset records a maximum monthly UV Index of 11+ during April, making sun protection particularly important for extended outdoor activities.[1]
5. Cozumel Weather in May
May is a transition month between Cozumel’s comparatively dry early-year conditions and the wetter part of the year.
Average daytime highs remain around 32°C (90°F), nighttime lows average 22°C (72°F), and Caribbean Sea temperatures reach approximately 28°C (82°F).
Rainfall increases substantially compared with April, reaching an average of about 110 mm (4.3 inches) across seven days with some rain.[1]
Heat and humidity also become more noticeable. Travelers planning ruins, walking tours, cycling, or other prolonged outdoor activities may prefer earlier starts and regular shade breaks.
6. Cozumel Weather in June
June brings a substantial increase in average rainfall.
Long-term figures show around 188 mm (7.4 inches) of precipitation and approximately 12 days with some rain. Temperatures remain high, with average daytime highs around 32°C (90°F) and lows near 23°C (73°F). Sea temperatures average about 28°C (82°F).[1]
June 1 also marks the official beginning of the Atlantic hurricane season, which continues through November 30.[2]
That does not mean Cozumel experiences a hurricane—or even severe weather—throughout this period. It means tropical-weather monitoring becomes more relevant as travel dates approach.
For detailed information about storm timing, travel considerations, and cruise implications, see our Cozumel hurricane season guide.
7. Cozumel Weather in July
July remains hot and humid, with average highs around 32°C (90°F) and lows near 23°C (73°F).
Average rainfall drops from June’s level to approximately 121 mm (4.8 inches), although around 12 days still record some rain. The Caribbean Sea averages a warm 28°C (82°F).[1]
The lower rainfall total compared with June is a useful reminder that Cozumel’s wetter season does not follow a simple month-by-month increase. Tropical rainfall varies significantly throughout the season and from year to year.
8. Cozumel Weather in August
August is the hottest month in this dataset, with an average daytime high around 33°C (91°F). Nighttime lows average approximately 23°C (73°F).
Sea temperature reaches around 29°C (84°F), making August part of Cozumel’s warmest-water period.
Average rainfall is approximately 146 mm (5.7 inches) across 13 days with some rain.[1]
Heat, humidity, and strong tropical sun can all affect outdoor comfort, so shade, hydration, protective clothing, hats, and sunglasses become particularly important during long days outside.
9. Cozumel Weather in September
September is one of Cozumel’s wettest periods.
In the climate dataset used for this guide, September has the highest average monthly rainfall at approximately 237 mm (9.3 inches), with some rain recorded on roughly 15 days.[1]
Average highs remain around 32°C (90°F), nighttime lows are around 23°C (73°F), and sea temperature remains close to 29°C (84°F).
September also falls near the climatological peak of Atlantic hurricane activity. The National Hurricane Center places the historical peak around September 10, with much of Atlantic tropical-cyclone activity concentrated between mid-August and mid-October.[2]
That is a reason to monitor forecasts and keep plans flexible—not to assume every September day will be stormy.
10. Cozumel Weather in October
October remains wet by Cozumel standards.
Average rainfall is approximately 212 mm (8.3 inches), with some rain on around 14 days. Air temperatures begin easing slightly, with average daytime highs near 31°C (88°F) and lows around 23°C (73°F).
Sea temperatures remain near their yearly peak at approximately 29°C (84°F).[1]
October is still within hurricane season, so current tropical forecasts become more useful than historical averages once you are close to your travel dates.
If rainfall is your main concern, see our detailed Cozumel rainfall guide.
11. Cozumel Weather in November
November marks a transition toward Cozumel’s cooler and generally drier winter pattern.
Average daytime temperatures drop to approximately 29°C (84°F), while nighttime lows average around 21°C (70°F). Sea temperature remains warm at approximately 28°C (82°F).
Average rainfall falls to about 105 mm (4.1 inches) across nine days with some rain.[1]
Cold fronts can become more relevant during this part of the year, occasionally changing wind and sea conditions even when temperatures remain comfortable on land.[3]
The official Atlantic hurricane season also continues until November 30.[2]
12. Cozumel Weather in December
December is one of Cozumel’s coolest months, with average daytime highs near 28°C (82°F) and nighttime lows around 19°C (66°F).
Average rainfall is approximately 96 mm (3.8 inches), with some rain on about nine days. The sea remains warm at approximately 27°C (81°F).[1]
Visitors should still be prepared for occasional breezy periods or winter fronts. These short-term changes matter especially for marine activities because air temperature alone cannot tell you whether the sea will be suitable for snorkeling or diving.
Dry Season vs. Rainy Season in Cozumel
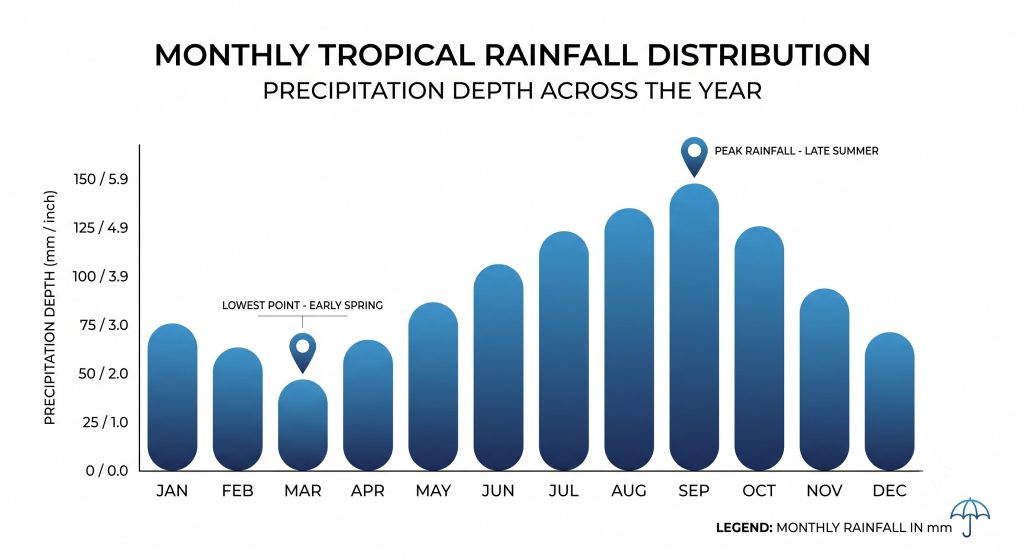
Cozumel’s rainfall patterns show distinct dry months in spring and peak precipitation in autumn.
Cozumel has a tropical climate, but rainfall varies considerably throughout the year.
The drier part of the year is generally concentrated in winter and early spring, with March and April showing particularly low rainfall in the dataset used above. Rain increases from May, with substantially wetter monthly averages during parts of summer and fall.[1]
That does not mean Cozumel’s wetter months experience continuous rain.
A monthly rainfall total tells you how much precipitation typically falls over the entire month. It does not tell you how long individual showers will last or whether a particular vacation day will be washed out.
Tropical rain can arrive as short, localized showers, while tropical systems or larger weather patterns can produce longer periods of unsettled conditions.
For more detail on rainfall patterns and what rainy days are actually like, see our Cozumel rainfall guide.
How Cozumel Weather Affects Snorkeling and Beach Conditions
Warm air and warm Caribbean water make Cozumel attractive for beach activities throughout the year, but air temperature is not the same thing as marine conditions.
Wind direction, wind speed, waves, currents, recent rainfall, visibility, and local restrictions can all affect conditions on the day you enter the water.
Wind, Trade Winds and Cold Fronts
Cozumel lies within the broader tropical trade-wind zone. Trade winds are prevailing easterly winds found across tropical latitudes.[4]
Local conditions are more complex than a single prevailing wind direction, however.
Research on the Yucatán Peninsula shows a stronger influence from cold fronts during approximately October through March, while sea-breeze circulation becomes more important through much of the warmer part of the year.[3]
For beach and snorkeling plans, this matters because a warm, sunny forecast does not automatically mean calm water.
Sea Temperature Through the Year
One of Cozumel’s most consistent climate features is warm Caribbean water.
The dataset used in this guide places average monthly sea temperatures between approximately 26°C (79°F) and 29°C (84°F) throughout the year. August, September, and October are the warmest months in this dataset at around 29°C (84°F).[1]
For a more detailed month-by-month breakdown, see our Cozumel water temperature guide.
Warm water does not guarantee good underwater visibility, weak currents, or calm surface conditions. Those factors should always be considered separately.
West Coast vs. East Coast Conditions
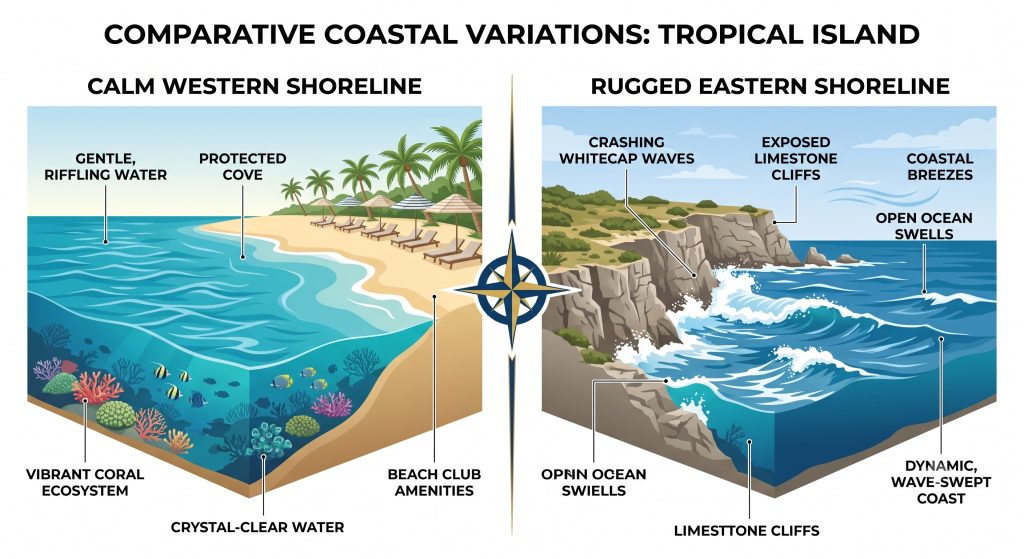
The sheltered west coast offers calm waters for snorkeling, while the open east coast faces raw Caribbean winds and waves.
Weather and sea conditions can affect different parts of Cozumel differently.
The island’s eastern coastline faces the open Caribbean, while much of the western shoreline faces toward the Yucatán mainland and is comparatively sheltered.
This geographic difference helps explain why many swimming, snorkeling, diving, beach-club, and waterfront dining activities are concentrated along Cozumel’s west coast.
The same geographic distinction matters when considering seaweed. The exposed east coast can receive more incoming sargassum, while the western coastline is generally more sheltered, although no coastline can guarantee completely clear conditions every day.
If seaweed conditions are part of your travel planning, see our Cozumel sargassum guide.
Planning to Snorkel in Cozumel?
Sunset Cozumel offers a guided shore-snorkeling experience with direct reef access from our beachfront location, equipment, and beginner-friendly guidance.
See our guided Cozumel shore snorkeling experience and check current weather and marine conditions before entering the water.
Humidity and How Hot Cozumel Actually Feels
Temperature alone does not fully describe tropical heat.
Humidity reduces the body’s ability to cool through evaporation, which is why 32°C (90°F) on a humid Cozumel afternoon can feel more demanding than the same air temperature in a dry climate.
The climate dataset used in this guide describes heat and humidity as more moderate during the cooler early-year period and increasingly intense through much of spring, summer, and early fall.[1]
Travelers who are sensitive to heat may find outdoor days more comfortable by starting demanding activities earlier, using shade regularly, staying hydrated, and choosing breathable clothing.
For snorkeling and beach activities, protective clothing such as a rash guard can also reduce direct sun exposure.
Sunshine and UV Levels in Cozumel
Cozumel receives substantial sunshine throughout the year, but sunshine hours and daylight hours are not the same measurement.
The climate dataset used for this guide shows approximately six to eight hours of sunshine per day, depending on the month, with roughly 11 hours of daylight in winter and up to around 13 hours during late spring and summer.[1]
UV exposure is significant year-round.
Maximum monthly UV Index figures in this dataset range from approximately 7 in January and December to 11 or higher during much of spring and summer.[1]
That makes sun protection relevant even on days when cloud cover makes the sun feel less intense.
For beach days, consider protective clothing, sunglasses, a hat, shade breaks, and any activity-specific guidance provided by your tour or beach operator.
Hurricane Season in Cozumel
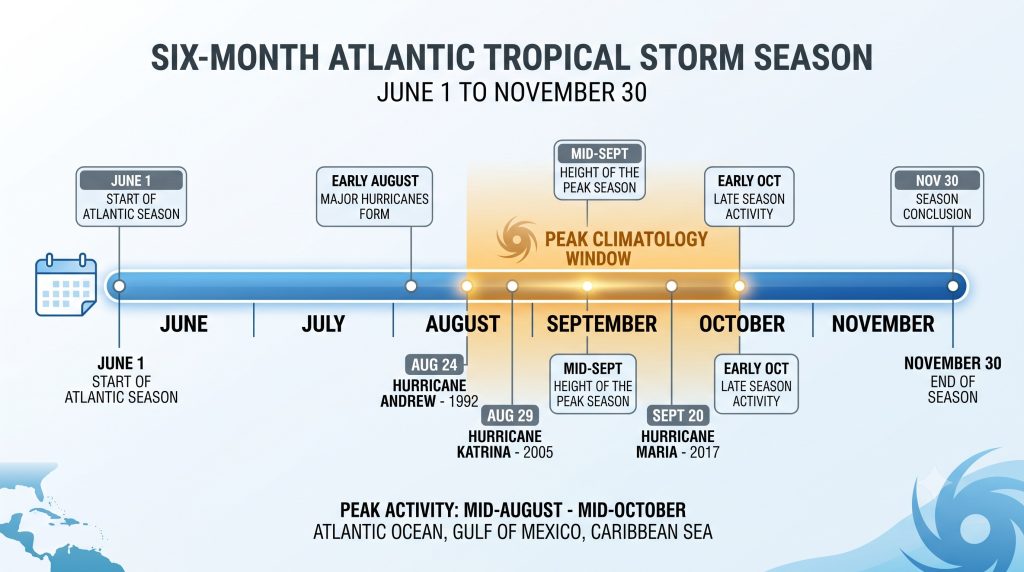
Official hurricane season spans June through November, with historical cyclone frequency peaking around mid-September.
Cozumel is in the Atlantic basin, so tropical systems affecting the island are referred to as hurricanes or tropical storms rather than typhoons.
The official Atlantic hurricane season runs from June 1 through November 30 and includes the Caribbean Sea.[2]
NOAA’s 1991–2020 climate period averages 14 named storms, seven hurricanes, and three major hurricanes per season across the entire Atlantic basin.[2]
Those figures describe the full Atlantic basin. They are not Cozumel-specific probabilities and should not be interpreted as the likelihood of a hurricane affecting your individual trip.
Historically, Atlantic tropical-cyclone activity peaks around September 10, with the greatest concentration of activity occurring from approximately mid-August through mid-October.[2]
Tropical cyclones can also occasionally occur outside the official season.
The practical lesson is straightforward: if you travel during hurricane season, monitor official forecasts as your trip approaches rather than assuming the season itself predicts conditions on your travel dates.
For storm history, cruise implications, and planning advice, read our hurricane season in Cozumel guide.
How to Check Cozumel Weather Before Your Trip
The most useful weather information changes depending on how far away your trip is.
- Several months before travel: Use monthly climate averages such as those on this page. They are useful for comparing March with September, but not for predicting the exact weather on a particular date.
- About a week before travel: Begin checking current local forecasts and any developing tropical weather relevant to the western Caribbean.
- On the day of a beach, snorkeling, or diving activity: Check current wind, sea, wave, and local operational conditions instead of relying only on a rain icon in a weather app.
- During Atlantic hurricane season, the National Hurricane Center provides official tropical-weather information for the Caribbean and wider Atlantic basin.[2]
- NOAA’s National Data Buoy Center also operates Station 42056 in the Yucatán Basin, approximately 120 nautical miles east-southeast of Cozumel, where regional offshore observations can include wind, waves, and sea temperature.[5]
Because the buoy is offshore and not located directly at a Cozumel beach, its data should be treated as regional context rather than a precise measurement of shore conditions.
If you plan to snorkel, also review our Cozumel snorkeling safety guide and follow current local instructions.
Cozumel Weather FAQs
What is the Hottest Month in Cozumel?
August is the hottest month in the climate dataset used in this guide, with an average maximum daytime temperature of approximately 33°C (91°F).
July and September are only slightly cooler at around 32°C (90°F), so late summer generally brings sustained heat and humidity rather than a single isolated hot month.[1]
What is the Rainiest Month in Cozumel?
September is the rainiest month in this dataset, averaging approximately 237 mm (9.3 inches) of precipitation and around 15 days with some rain.
October follows at approximately 212 mm (8.3 inches).[1]
Rainfall figures can vary somewhat between climate datasets and observation periods, so these numbers should be treated as long-term planning averages rather than forecasts for a specific trip.
What is the Driest Month in Cozumel?
March has the lowest average rainfall in this dataset, at approximately 38 mm (1.5 inches).
April follows at around 46 mm (1.8 inches). Both months combine relatively low average rainfall with warm daytime temperatures.[1]
What is the Coolest Month in Cozumel?
January and December have the lowest average daytime highs in this dataset, both at approximately 28°C (82°F).
January, February, and December also share average nighttime lows of about 19°C (66°F).
Even during Cozumel’s cooler months, average Caribbean Sea temperatures remain around 26–27°C (79–81°F).[1]
Does Rain Usually Ruin a Whole Day in Cozumel?
Not necessarily.
A monthly rainfall figure can include a combination of short tropical showers and longer periods of unsettled weather. It does not tell you how long rain will last on a particular day.
The more useful approach is to check short-range forecasts near your travel dates and keep plans somewhat flexible during wetter months.
For a fuller explanation, see our Cozumel rainfall guide.
Can I Plan a Snorkeling Trip Using Monthly Weather Averages?
Monthly weather averages can help you choose a season, but they cannot tell you whether conditions will be suitable for snorkeling on a specific day.
Before entering the water, consider current wind, waves, currents, visibility, marine conditions, and any local restrictions.
Beginners may also prefer supervised shore access rather than choosing a snorkeling location based only on seasonal climate averages.
Sunset Cozumel’s guided shore snorkeling experience provides instruction, equipment, and direct shore access.
Plan Your Cozumel Day Around the Conditions, Not Just the Calendar
There is no single month when every weather variable is perfect.
Travelers who prefer lower rainfall and less intense heat may favor the earlier part of the year. Visitors who prioritize the warmest Caribbean water will find higher sea temperatures during late summer and early fall, but those months also bring greater heat, humidity, rainfall, and tropical-weather awareness.
The best approach is to use this monthly guide for long-range planning, then check the actual forecast and marine conditions close to your activity date.
Already know when you are visiting?
Explore the best snorkeling spots in Cozumel from shore, review our Cozumel snorkeling safety guide, or choose a guided shore snorkeling experience at Sunset Cozumel.
Ready for a Cozumel Beach and Snorkeling Day?
Sunset Cozumel is located on the island’s west coast, with shore snorkeling, oceanfront dining, and water activities available from the property.
Check the weather and marine conditions for your travel date, then view our shore snorkeling experience or contact Sunset Cozumel to plan your visit.
References
[1] Weather2Travel – Cozumel Climate & Weather Averages : https://www.weather2travel.com/caribbean-coast-mexico/cozumel/climate/
[2] NOAA National Hurricane Center – Tropical Cyclone Climatology: https://www.nhc.noaa.gov/climo/
[3] NOAA Institutional Repository – Surface Wind Variability Over the Yucatán Peninsula: https://repository.library.noaa.gov/view/noaa/64192
[4] NOAA Ocean Service – What Are Trade Winds?: https://oceanservice.noaa.gov/facts/tradewinds.html
[5] NOAA National Data Buoy Center – Station 42056, Yucatán Basin: https://www.ndbc.noaa.gov/station_page.php?station=42056&unit=E